
Menu Engineering: A 30-Item Menu, +$1,917 a Month
 Ali Tanis7 min read
Menu engineering ranks every dish by two numbers — what it earns and how often it sells — then rebuilds the page so customers order more of the ones that do both. It is arithmetic, not fashion. Most articles stop at that definition. This one runs the method on a real 30-item bistro menu and shows the $1,917 a month it moved.
Quick Summary: Menu engineering plots each dish on two axes — contribution margin and share of unit sales — then sorts them into stars, plough-horses, puzzles and dogs. Each quadrant gets one specific move. Three changes here added $1,917 a month.
What menu engineering actually is
Michael Kasavana and Donald Smith built the method at Michigan State University's School of Hospitality Business in 1982. A menu is not a list; it is a sales floor where the best shelves belong to the dishes that pay the rent. Two inputs, one grid, four verdicts — no software, just a spreadsheet and 90 days of POS data.
The two numbers you need for every dish
Contribution margin. Menu price minus plate cost. A short rib at $32 with $9.60 of ingredients contributes $22.40 — that is what walks to the bank, not the percentage.
Popularity. A dish's share of its category's unit sales, using 60–90 days of history. Unit share, not revenue share.
Then two averages: mean profitability across the menu, and "fair share" — 100% divided by the number of menu items in the category. The method sets the popularity line at 70% of fair share, so a big category cannot condemn half its dishes.
Never use food cost percentage as an axis: it flatters cheap dishes, and restaurants deposit dollars, not percentages.
The four quadrants, and the one move each demands
Plot all 30 menu items against those lines. Where a dish lands — profitability against popularity — is your verdict, based on data not instinct.
Stars: protect them, change nothing
Strong profitability, strong popularity. The instinct is to improve a profitable dish. Resist it. Hold the spec, keep it off the discount list, give it the best position and photograph guests see.
Plough-horses: earn more per plate
Popular and thin. The fried chicken feeds the room and pays little. In rising order of risk: re-spec the costliest component, bundle it with a high-margin side, then raise the number a dollar or two — never in the same month as a portion cut.
Puzzles: make it sell, or let it go
Good profitability, no attention. Something stops guests choosing it: an unclear name, a weak slot, no picture, or a server who never mentions it. Fix those four, in that order. If it will not move in a quarter, it is a dog with a good margin.
Dogs: cut, unless the dish does another job
Weak on both axes. Cut it — a shorter menu means faster tickets and less waste. Real exceptions: a dish covering a dietary need, one sharing prep with three others, or a signature your regulars would riot over.
Worked example: 30 items, one month of sales
A bistro, 30 menu items, 6,200 plates last month. Mean margin is $11.40; fair share is 100 ÷ 30 = 3.33%, so the popularity line sits at 2.33%. Four dishes show every quadrant:
| Dish | Price | Cost | Margin | Share | Quadrant |
|---|---|---|---|---|---|
| Short rib | $32.00 | $9.60 | $22.40 | 6.6% | Star |
| Fried chicken | $19.00 | $8.55 | $10.45 | 10.3% | Plough-horse |
| Scallops | $34.00 | $12.40 | $21.60 | 1.4% | Puzzle |
| Quinoa bowl | $16.00 | $6.10 | $9.90 | 1.2% | Dog |
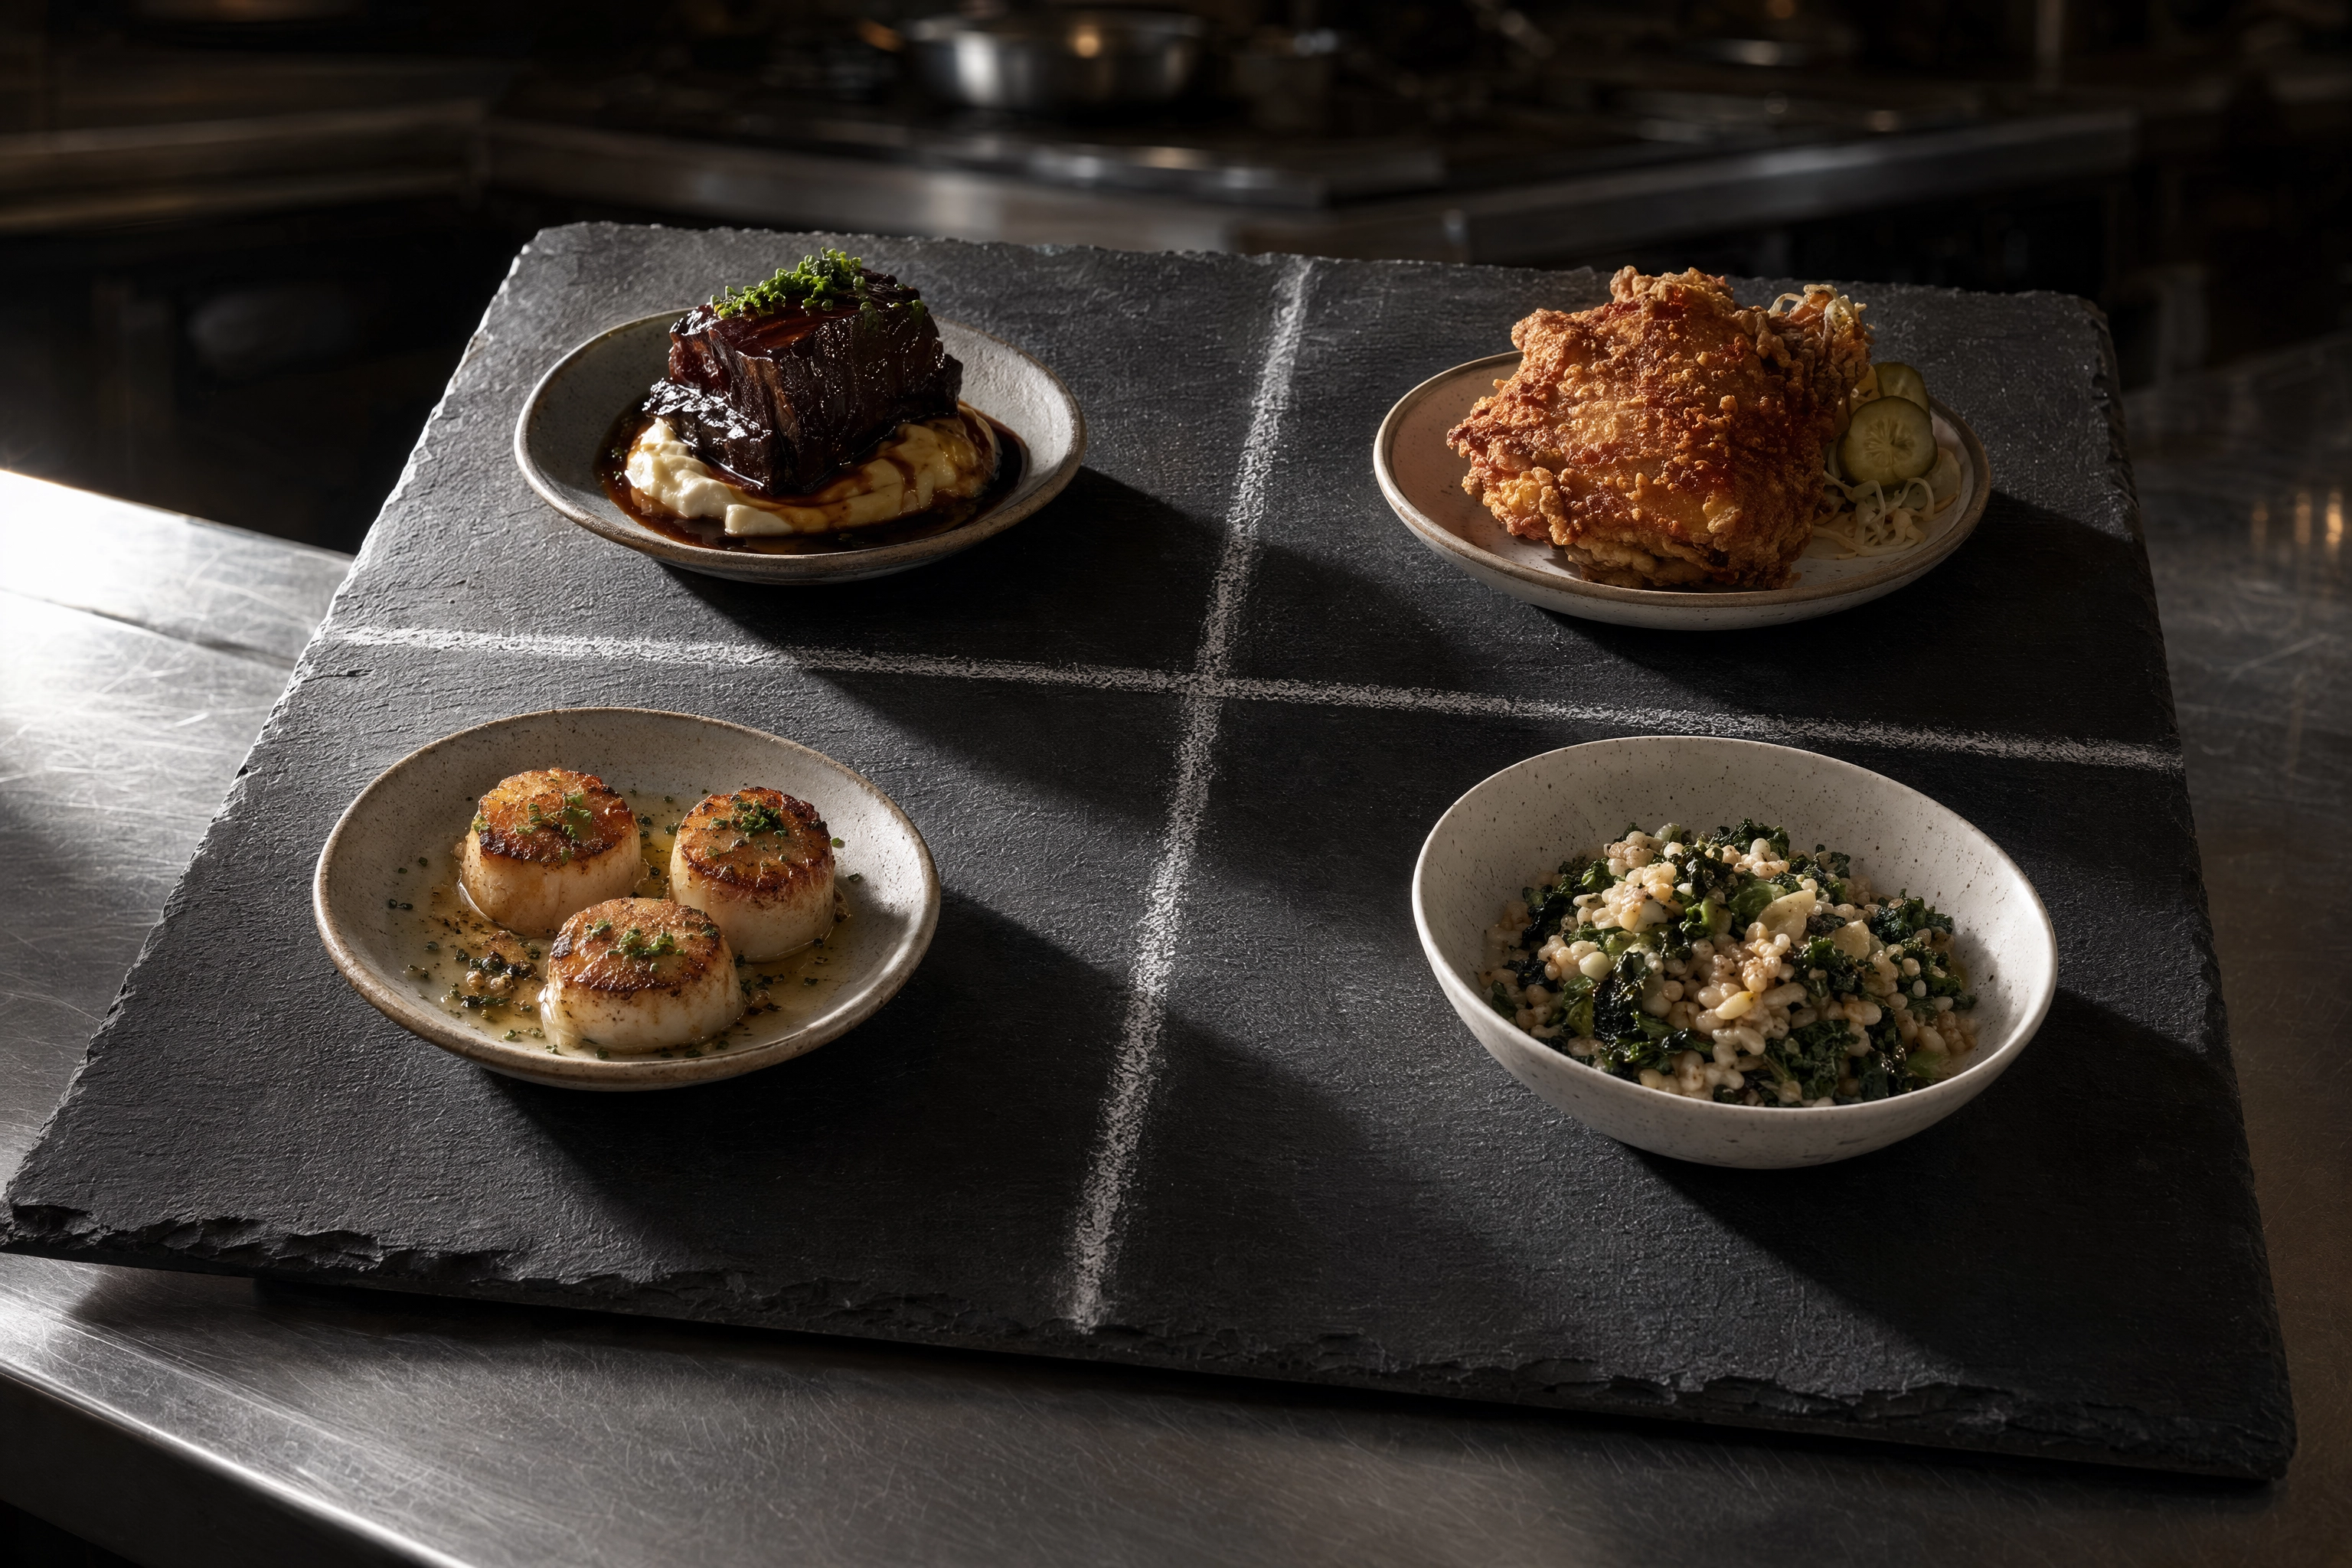 Four plated dishes placed in a chalk-drawn four-quadrant grid on a slate board, the menu engineering matrix in physical form
Three changes followed, none touching a recipe:
- Scallops got a photograph, a clearer name and the top slot in mains. Volume rose from 88 to 150 — at $21.60 each, +$1,339 a month.
- Fried chicken moved to $20.50, lifting its margin to $11.95. Even at 5% lost volume, 608 × $11.95 = $7,266 against $6,688: +$578.
- The quinoa bowl came off, counted at zero.
That is $1,917 a month, about $23,000 a year, from one afternoon and one photo session. Layout rules: our restaurant menu design walkthrough.
The lever you can pull this week: photograph the puzzle
Three of the four actions are slow: re-speccing needs a supplier conversation, cutting a dog needs a reprint, repricing needs nerve. Only one finishes before Friday with no kitchen change: put a good picture on the dish.
Item-level proof comes from delivery platforms, which see the counterfactual. Studying 15,000 merchants in 2022, DoorDash reported that menus with item photos earn up to 44% more monthly sales; a storefront header image adds up to 50%. That is a popularity-axis intervention measured per dish — the visual logic behind orders on Uber Eats and every delivery app listing.
Sequence matters: shoot your stars and puzzles, not the entire menu — four to eight menu items carry the grid. Our menu photography walkthrough covers the shot list, photo menus covers placement, and the rejection traps come first.
FoodShot AI was built for that step: upload a phone photo of the dish you serve and it returns a 2K, menu-ready image in about 2 minutes — one dish at a time, no full menu photoshoot required. It enhances the real plate rather than inventing one — platforms reject images that misrepresent what customers receive. Style references by cuisine, food type, steak, pasta, desserts, cocktails and plate staging match each category. Credits: our pricing page.
Menu psychology: what holds up, what does not
The sweet spot is a myth
Almost every guide repeats the "golden triangle": eyes land mid-page, dart top right, then top left. Eye-tracking disagrees. In a 2012 study in the International Journal of Hospitality Management, Sybil Yang found diners read menus sequentially, like a book, with no location holding attention longer. She did find a sour spot: the paragraph about the restaurant. Placement within a category is what menu design actually controls; magic coordinates are not.
Anchors and decoys
Your priciest main at the top of a section resets what "normal" costs, so the $32 dish under it reads as sensible to customers. A decoy is the same trick: a worse deal beside the one you want chosen.
Drop the currency symbol
In a Cornell field study at the Culinary Institute of America, guests given plain numerals — 22, not $22.00 — spent more than customers whose menus carried a dollar sign. Descriptive labels ("slow-braised" rather than "braised") increased sales 27% in six weeks. Kill dotted leader lines.
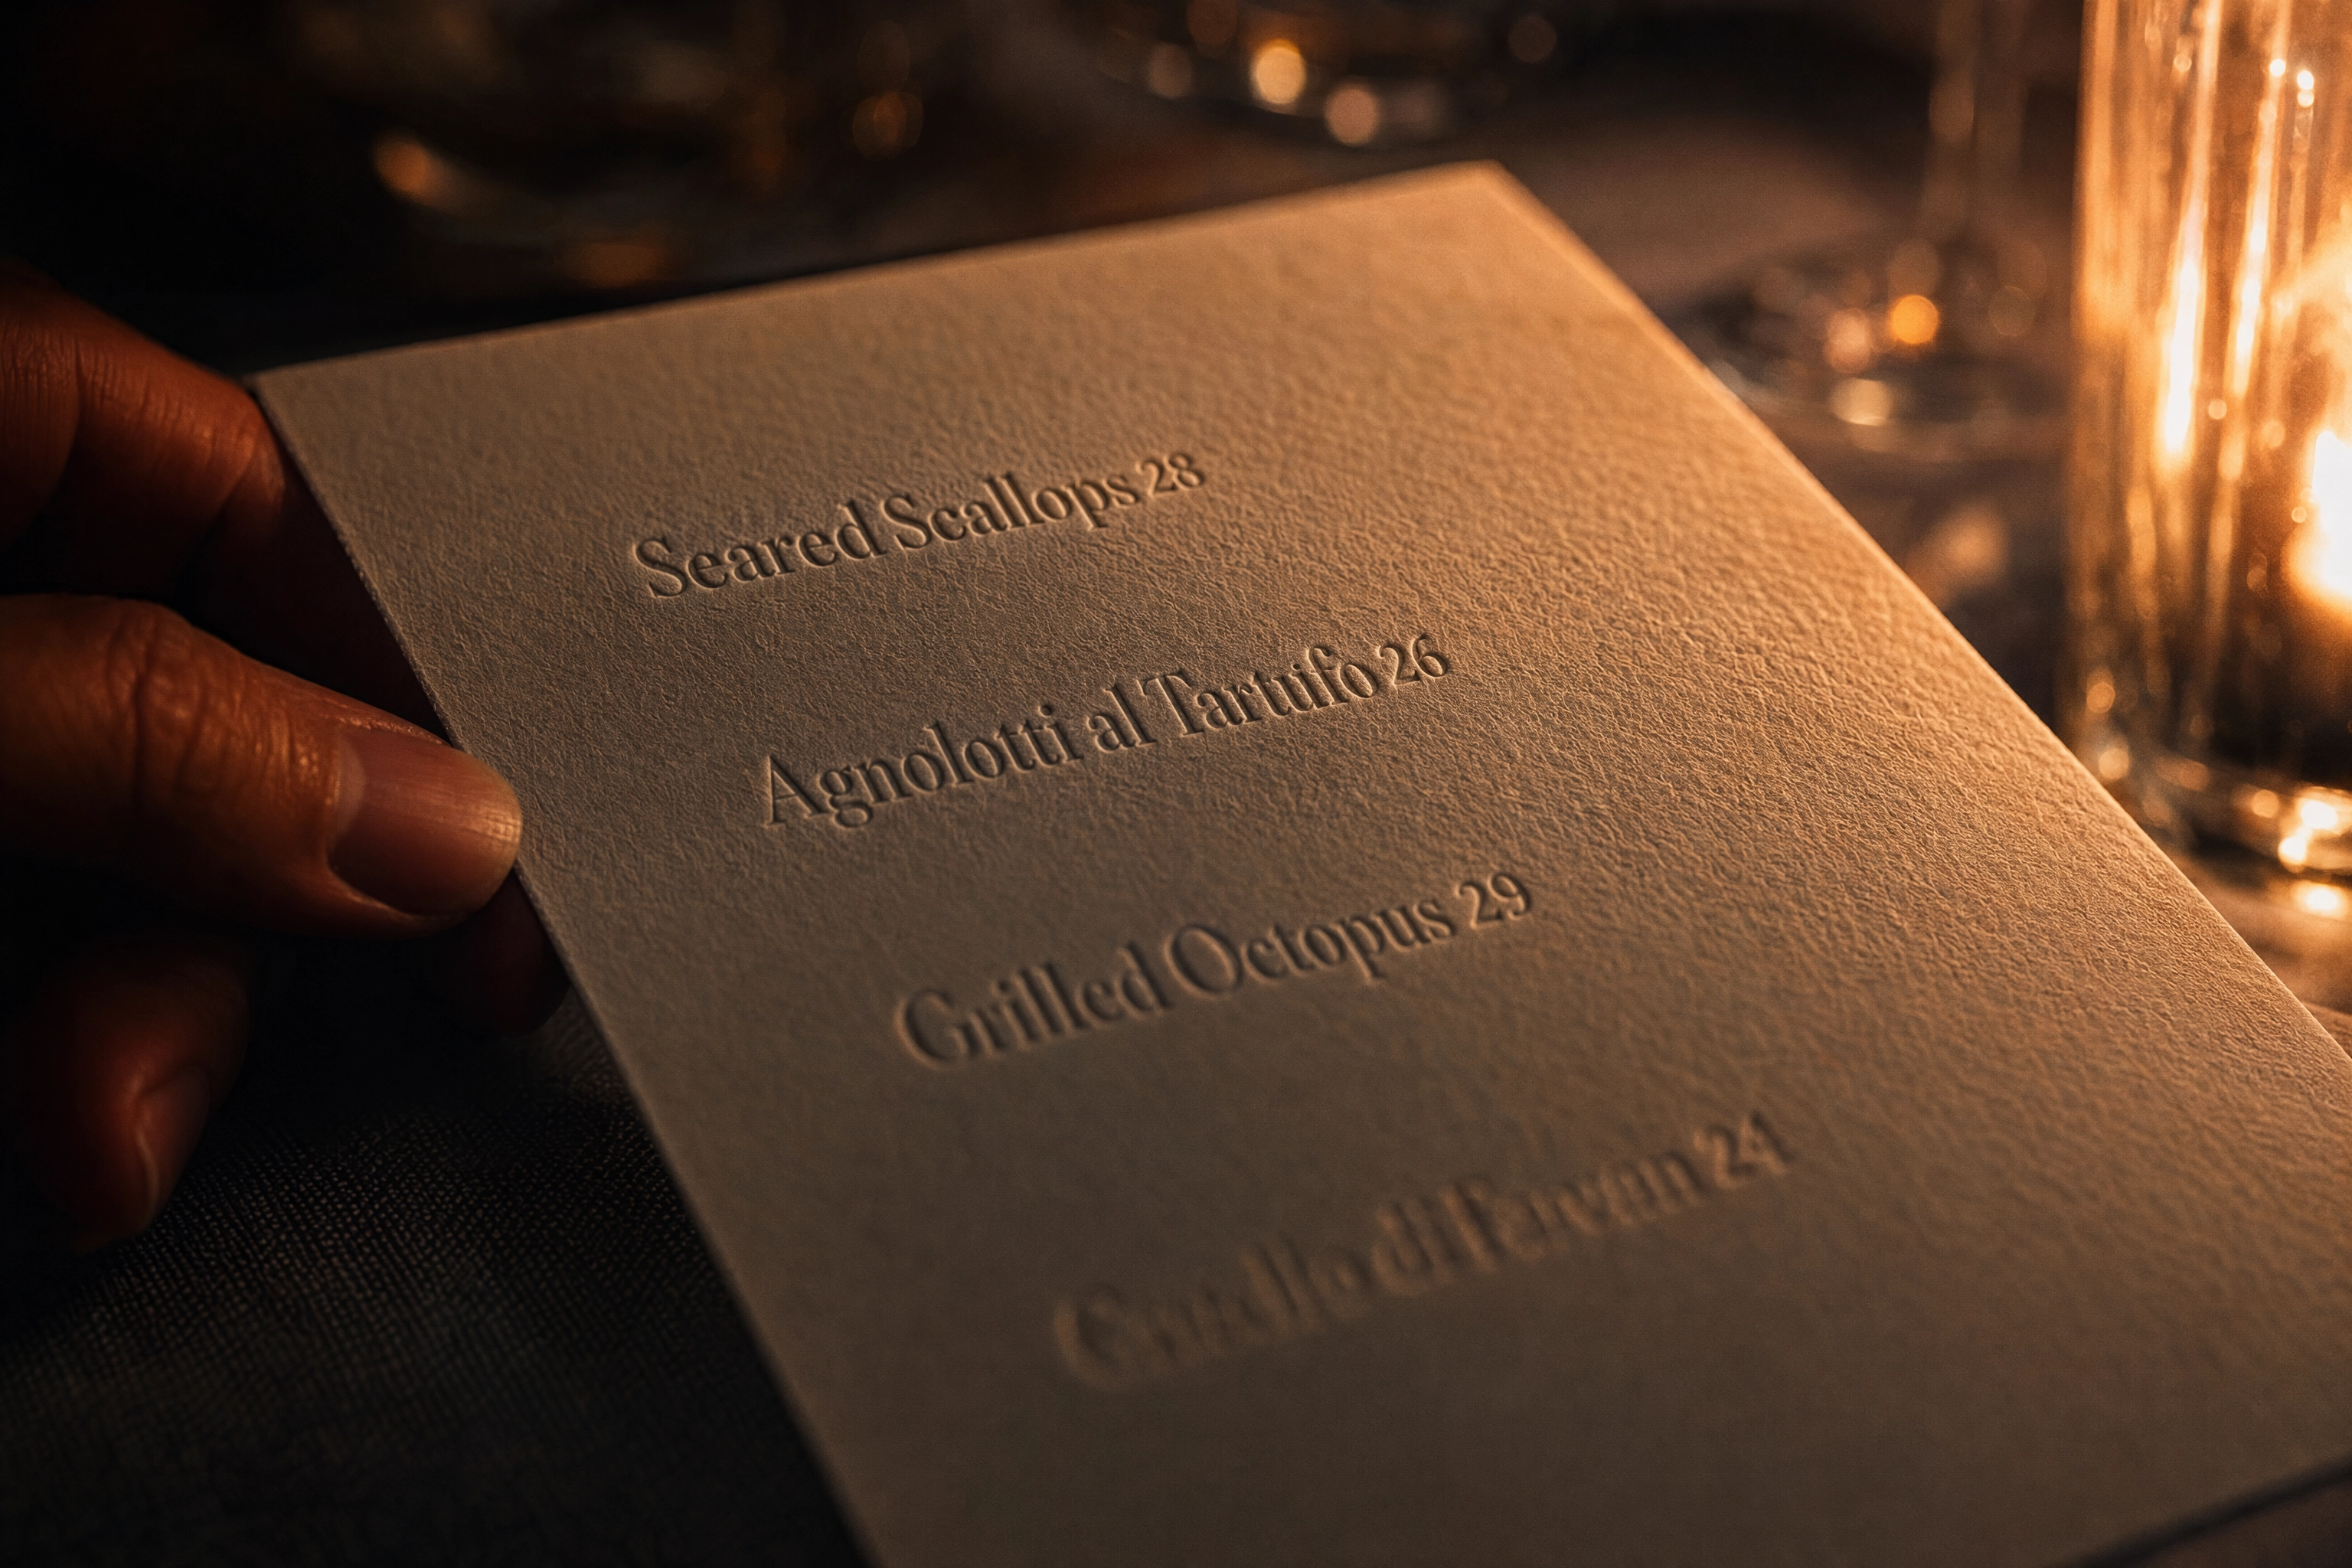 Candlelit close-up of an embossed menu card with plain numeral prices and no currency symbols beside a diner's hand
Frequently Asked Questions
How often should a restaurant redo menu engineering?
Quarterly for the full grid, monthly for a glance at the top and bottom five items. Slower, and seasonal swings have eaten the profitability you calculated.
Do I need software to do menu engineering?
No. Six spreadsheet columns — dish, units sold, share, price, plate cost, margin — cover it. Restaurant management software helps once recipe costs update based on invoices, but our consultant playbook shows plenty of operators using Excel and nothing else.
Does menu engineering work for a delivery-only menu?
Better: the platform hands you clean data on every dish, and pricing and imagery change instantly rather than at the next reprint. Ghost kitchens should read delivery menu planning; the same grid drives menu boards, digital boards and food truck menus.
Is menu engineering the same as menu psychology?
They overlap without being identical. Engineering is the strategic analysis — two axes, four quadrants — naming the profitable menu items to promote. Psychology is the layer that carries that verdict to guests. For example, cafés, pizzerias, fine dining rooms and restaurants run identical data through four different photography briefs.